Manufacturing Anomaly Detection
Real-time anomaly detection across machine health signals: flags what looks wrong now, across any combination of telemetry dimensions.
#AnomalyDetection
#MachineTelemetry
Experience the demo to see machine health data come to life, detect anomalies in real time, and surface critical issues before they escalate.
What it does
Industrial machines emit health signals continuously — motion and speed data, alarm and fault codes, power and battery state, component load indicators. The question operators need answered in real time is simple: is this machine behaving normally right now, or is something wrong?
This platform answers that question across multiple signal dimensions simultaneously, and surfaces the answer through a live dashboard. When something looks off, operators get an alert with context: which signal flagged, how long it held, how it compares across the fleet. Not a raw threshold number.
What operators see:
Live health scores per machine, updated continuously
Anomaly alerts with context — which dimension flagged, severity, duration
Historical trends showing how machine behaviour has shifted over time
AI-assisted interpretation of current state: what the pattern likely means and what to do about it
Why real-time detection matters
Most industrial monitoring systems fire on every sensor blip, so operators learn to ignore them. This platform is built differently.
Persistence over spikes. A flag only fires when a condition holds across multiple consecutive readings. Single out-of-range values disappear. Sustained conditions become signals.
Fleet-relative benchmarking. Each machine is evaluated against its peers, not just an absolute threshold. A machine running at 6% deviation looks normal until you see the rest of the fleet is at 1%. Static thresholds miss this; fleet-relative scoring catches it.
No rip-and-replace required. The platform connects to your existing telemetry — regardless of where it lives, what format it’s in, or which systems hold it. No mandatory historian, no database migration, no cloud lock-in.
Where this fits in your maintenance journey
Anomaly detection is the foundation of predictive maintenance, not the end state.
Phase 1 (this platform): Detect anomalies in real time. Build a labelled record of what “abnormal” looks like in your specific environment and on your specific equipment.
Phase 2: Use that labelled dataset to train a predictive model that forecasts failures with lead time, before they happen. This is what Fleet Health Intelligence does for vehicle fleets.
Customers who don’t yet have historical failure data start here. The anomaly detection phase builds the dataset that makes the forecasting phase possible.
Architecture
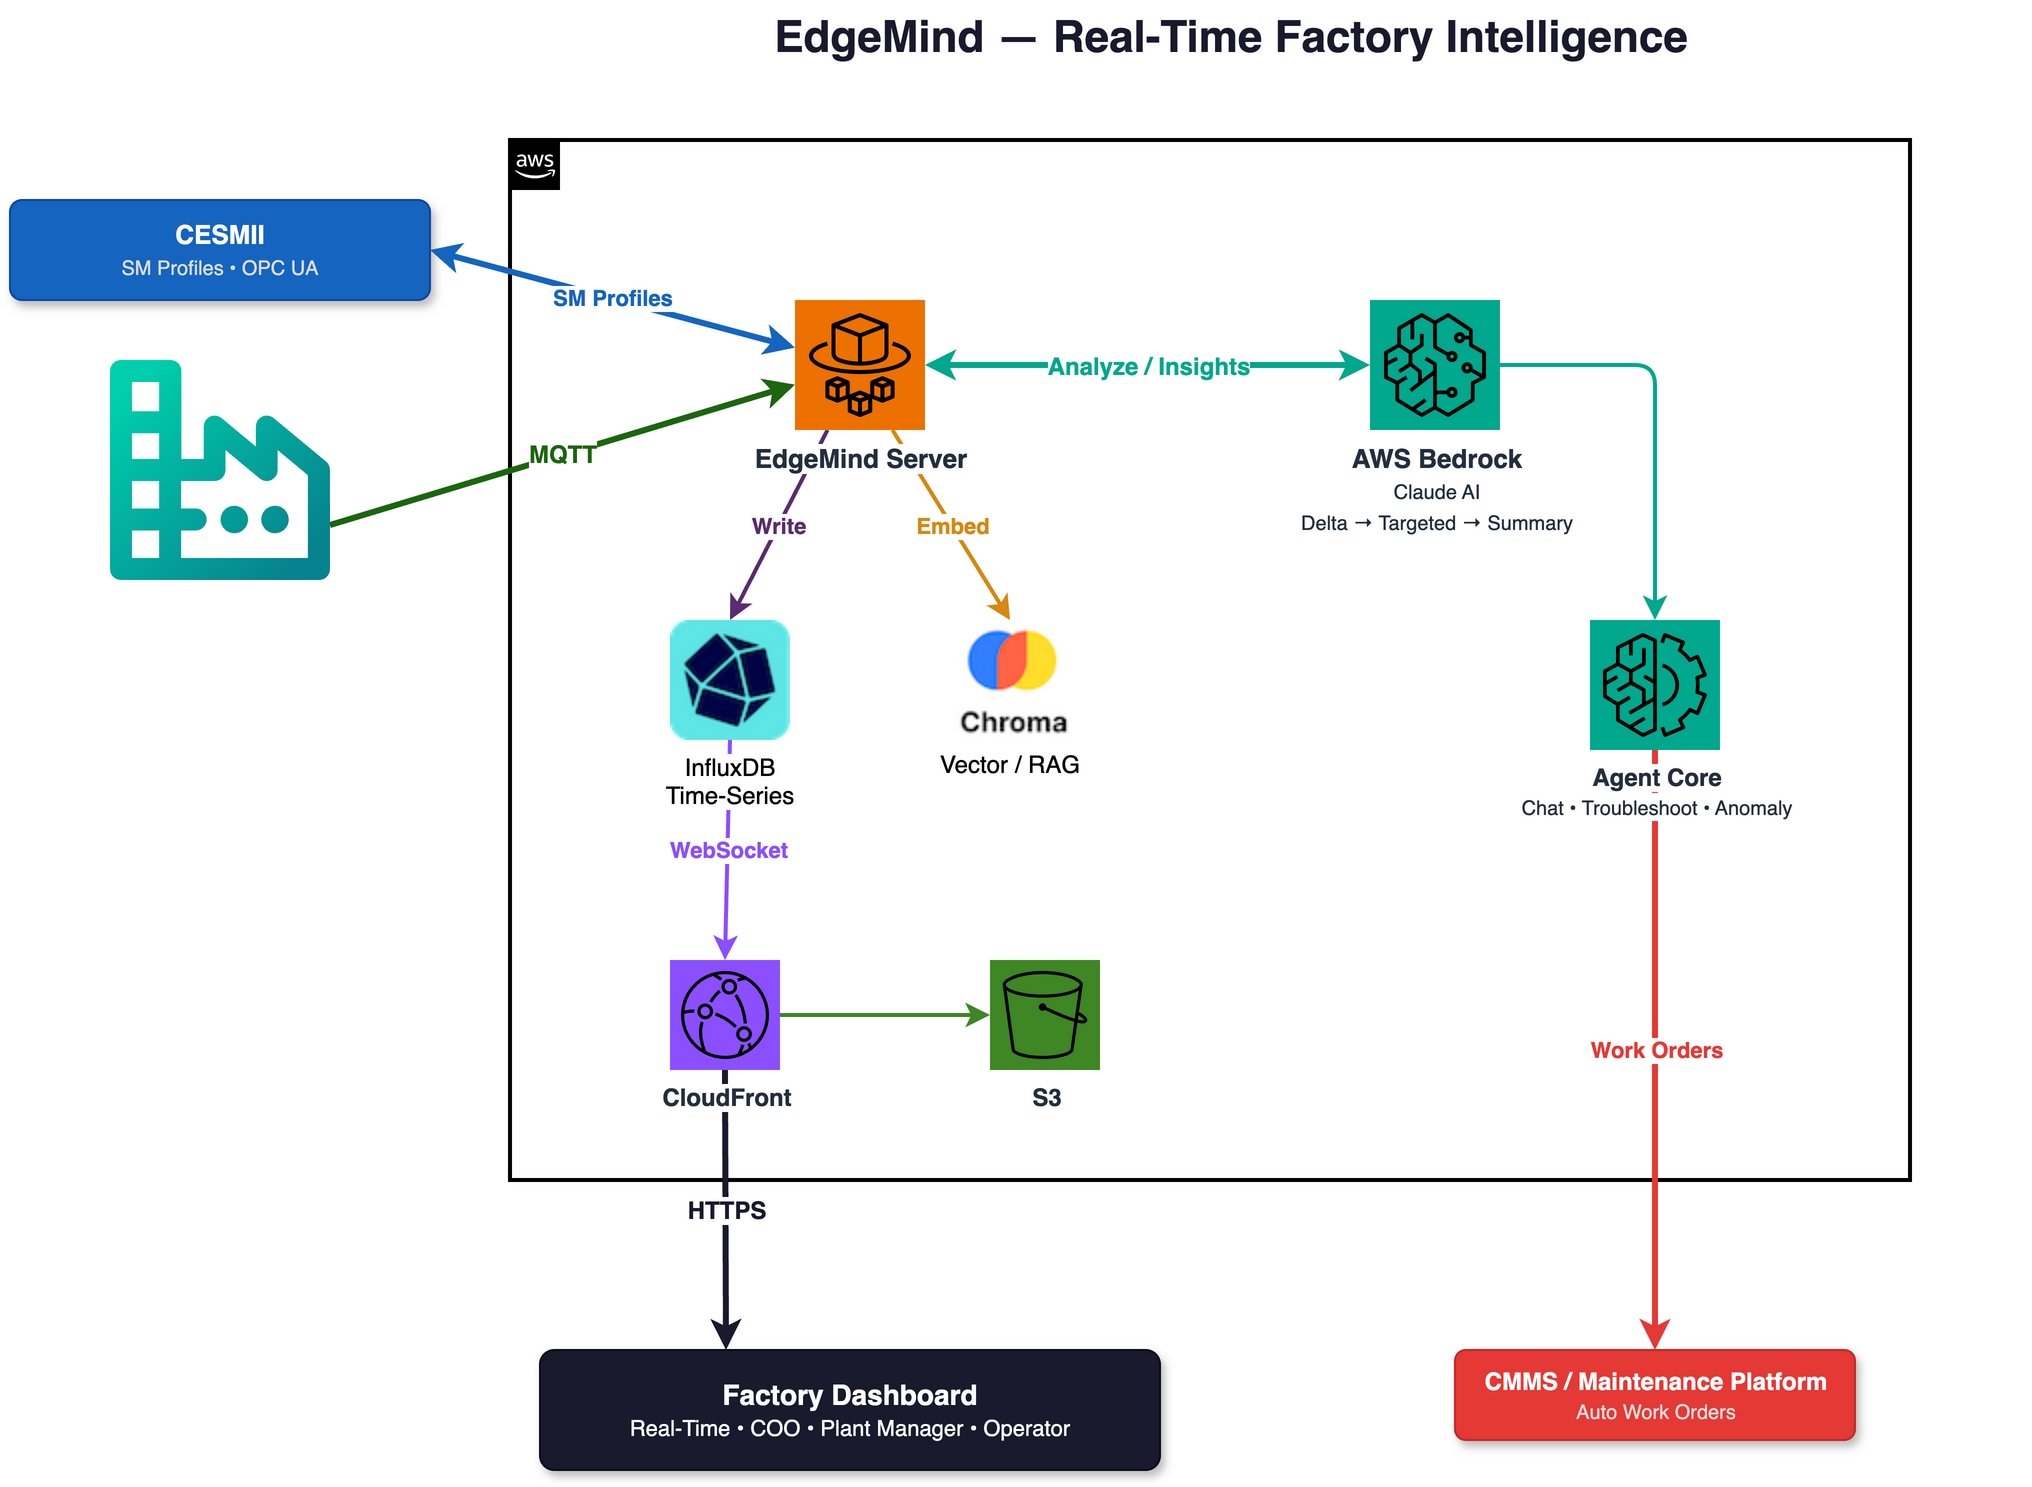
Machine Telemetry → Ingestion → Multi-Dimensional Detection → Anomaly Store → Live Dashboard
The detection layer runs independent pipelines per health dimension, each with its own failure domain, so an issue in one signal category never affects the others. All pipelines share a common ingestion layer that handles normalization across machine types and writes results to a queryable store.
Results feed a live dashboard showing current health scores, active anomalies, and historical trends. An AI layer interprets the pattern across dimensions and generates plain-language insights: what the pattern means and what action to consider, not a bare “anomaly detected.”
The architecture is storage-agnostic and communication-agnostic: it reads from wherever your telemetry lands today and integrates with the alerting and maintenance workflows your team already uses.
Don't wait for a single threshold to trip. Get real-time anomaly detection that flags what's actually wrong right now, across any combination of your machine's telemetry signals.