EdgeMind
Factory Telemetry with Agentic Analysis
Factory MQTT telemetry, stored as time series, analysed every 30 seconds by an LLM running against a five-minute rolling window. Anomalies become natural-language insights.
#Agentic Workflow
#Time-series Telemetry
#Anomaly Detection
Experience the demo to watch factory telemetry stream in and turn into agentic insights in real time.
What it does
A factory broadcasts telemetry over MQTT — temperatures, throughputs, machine states, counts. EdgeMind subscribes to the firehose, writes the numeric data to a time-series store, and runs an agentic analysis loop every thirty seconds against a rolling five-minute window. The output is a natural-language summary of what’s happening, with anomalies called out and trend shifts flagged.
The dashboard you see in the demo shows the raw data on one side and the agentic insights on the other. The visitor can watch the two stay in sync.
Why it matters
Time-series tooling solves the storage problem. It does not solve the noticing problem. Most factory operators don’t have time to watch a Grafana board — they need the system to tell them when something interesting happened, in language a human reads in two seconds.
Architecture
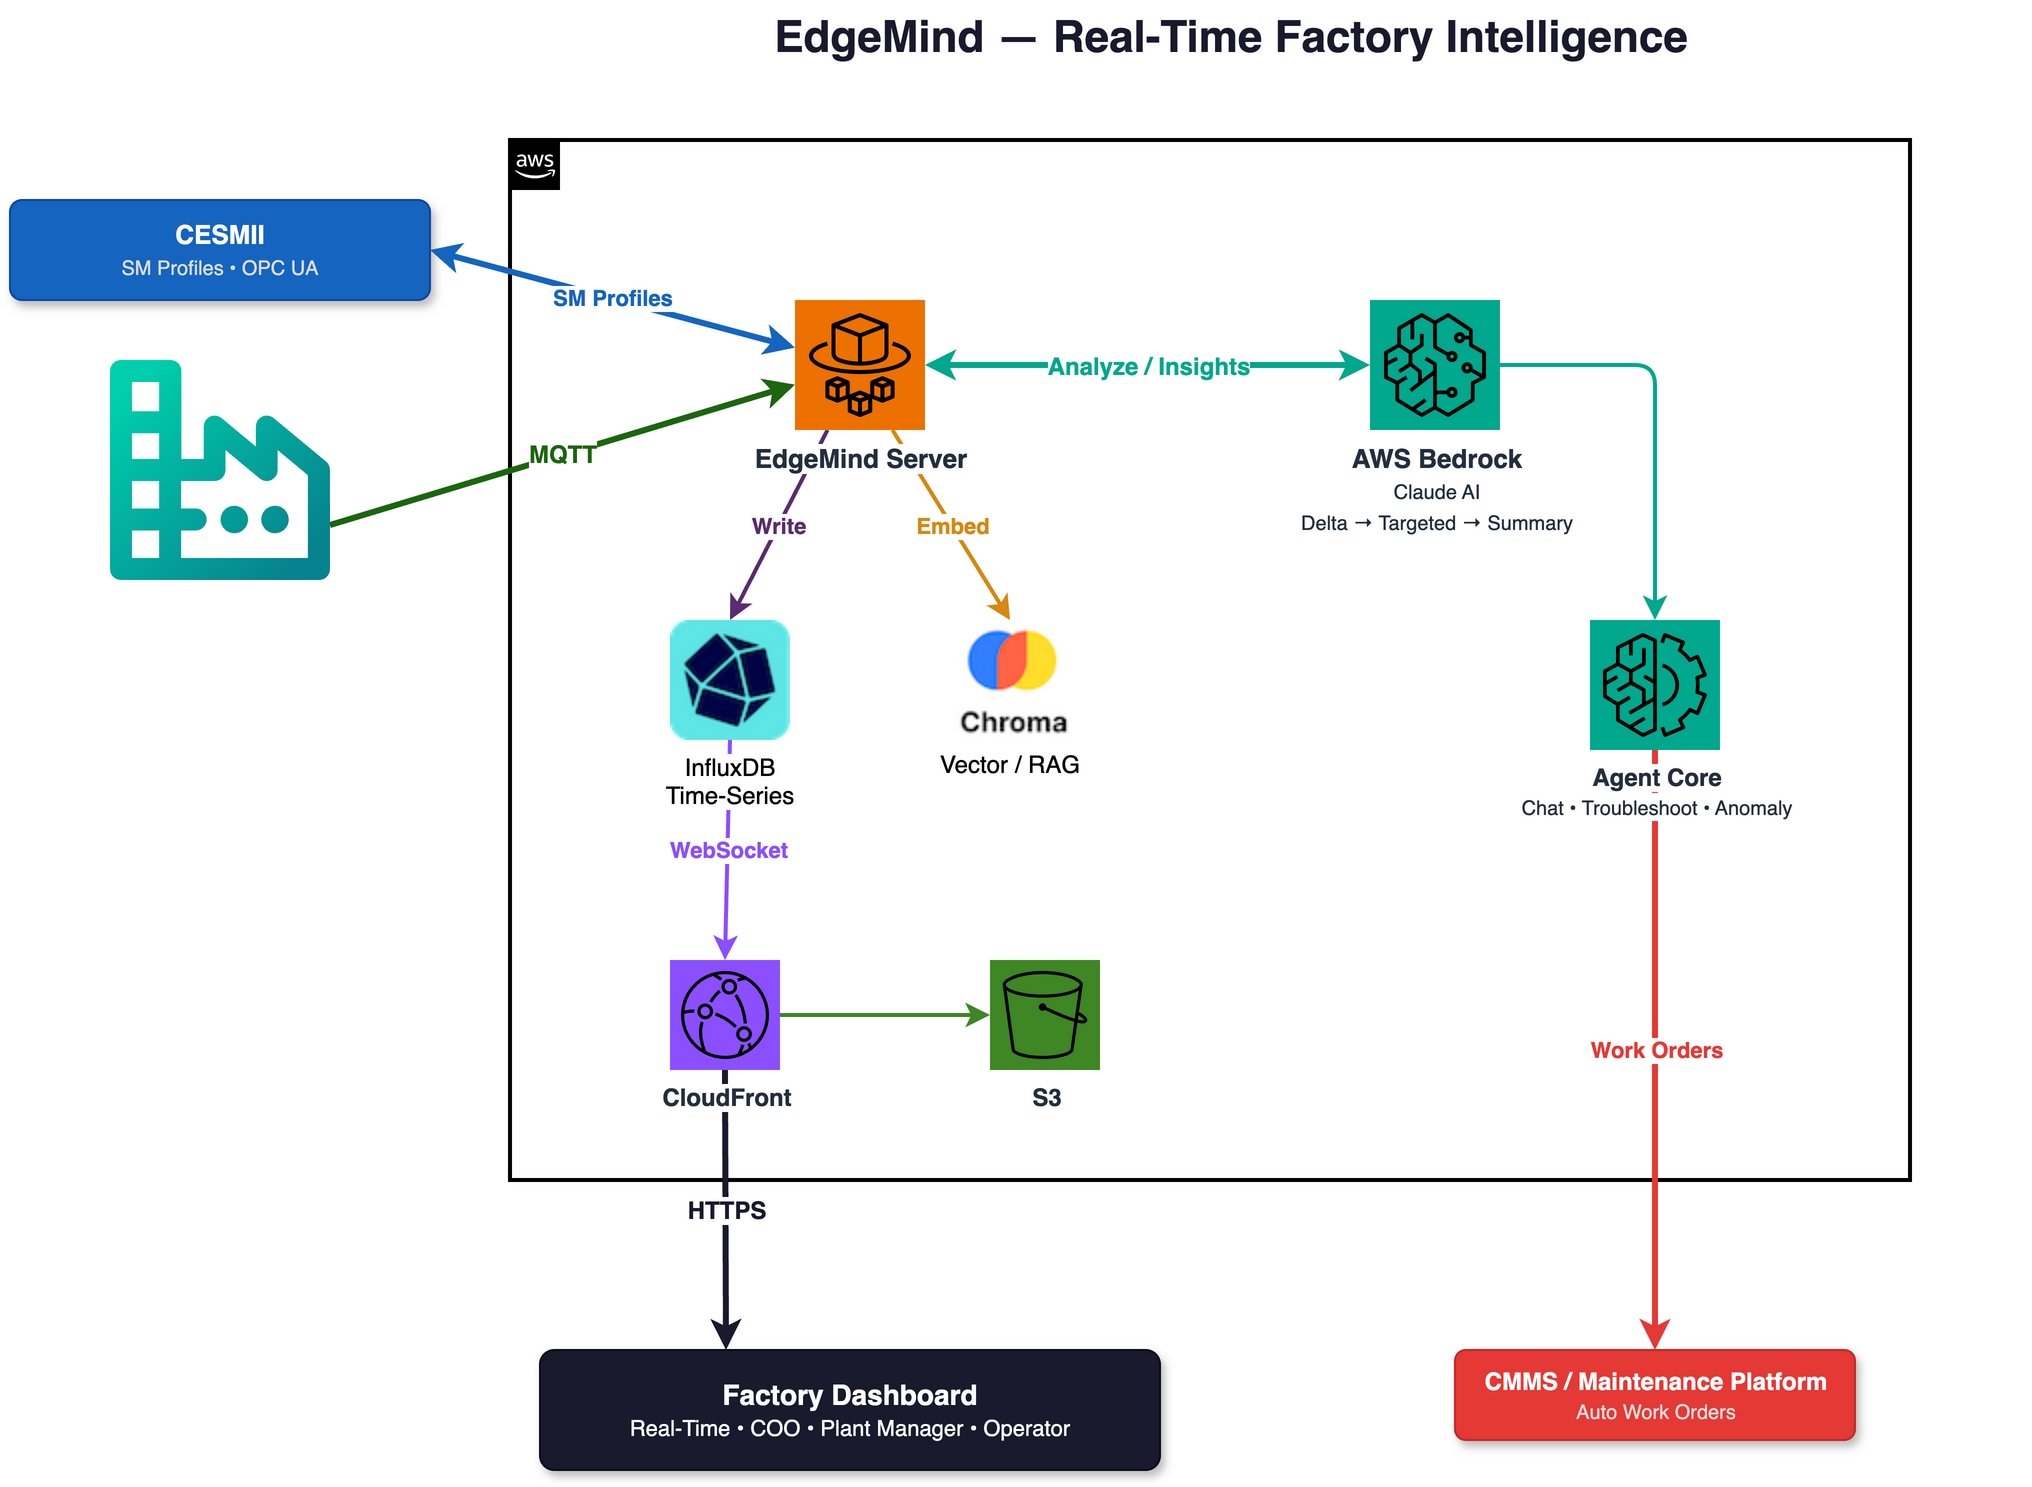
MQTT / SM Profiles → EdgeMind Server → Write (InfluxDB) + Embed (Chroma) + Analyze (Bedrock) → WebSocket → Factory Dashboard; Bedrock → Agent Core → Work Orders → CMMS / maintenance platform
Telemetry ingestion: a Node.js subscriber connects to the MQTT broker and writes every incoming tag value into InfluxDB. A throttled WebSocket relay pushes the same live stream to the browser.
Agentic analysis loop: every 30 seconds, the system queries a rolling five-minute window from InfluxDB and sends it to the LLM. The model returns a plain-English summary covering what changed, what looks anomalous, and what is trending. That summary is broadcast over the same WebSocket immediately.
Browser dashboard: a lightweight static HTML/JS interface shows raw telemetry and live agentic insights side by side, updating as each new analysis arrives.
How it fits your existing stack
Protocol-agnostic ingestion. Connects to any MQTT broker or OPC UA / SM Profile endpoint. No changes to existing PLCs, SCADA systems, or historian configuration. EdgeMind subscribes as a read-only client.
No schema or mapping required. Tag names and topic structures are discovered at subscription time. Onboarding is a broker URL and topic filter, not a data-mapping exercise. Works with whatever naming conventions already exist on the plant floor.
Storage-flexible. Ships with InfluxDB for time-series storage; can write to an existing historian if the client already operates one. The Chroma vector store handles embedding for recent telemetry context, running as a lightweight sidecar with no external dependencies.
LLM layer is swappable. Currently runs against AWS Bedrock (Claude). Designed to work with any OpenAI-compatible inference endpoint, including on-premise models for air-gapped or data-sovereign deployments.
CMMS-ready output. The agent core produces structured findings alongside natural-language summaries. Work orders can be routed to existing maintenance platforms (SAP PM, Maximo, Limble) without manual triage.
Edge-deployable. The full stack (subscriber, time-series store, agentic loop, WebSocket relay) runs on a single edge node. No factory data needs to leave the site.
Turn live factory telemetry into clear, agentic insights that operators can read in seconds.